

































 /SC-1600

 TOP
TOP


Eye Care Data Management Platform
EyeLink™
Features
-
-
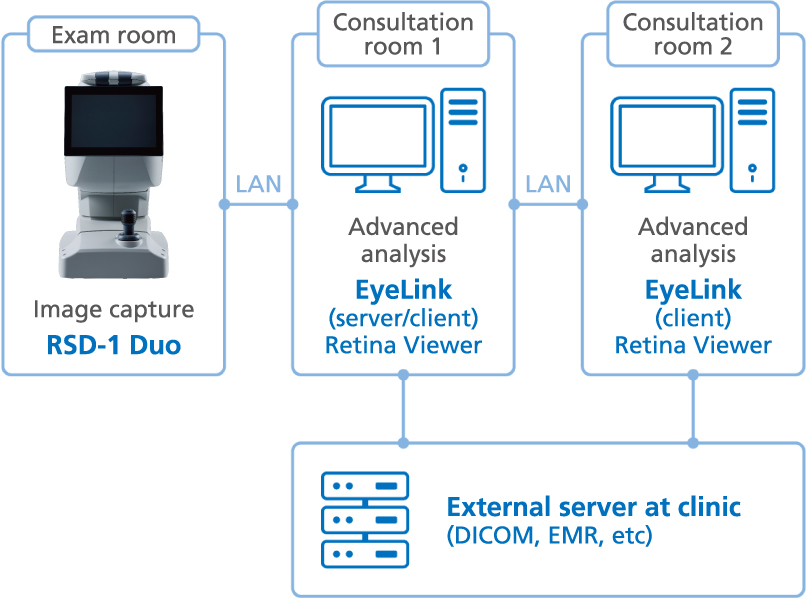
- Platform to store, manage, analyze and display eye care data
- DICOM and HL7 communication*
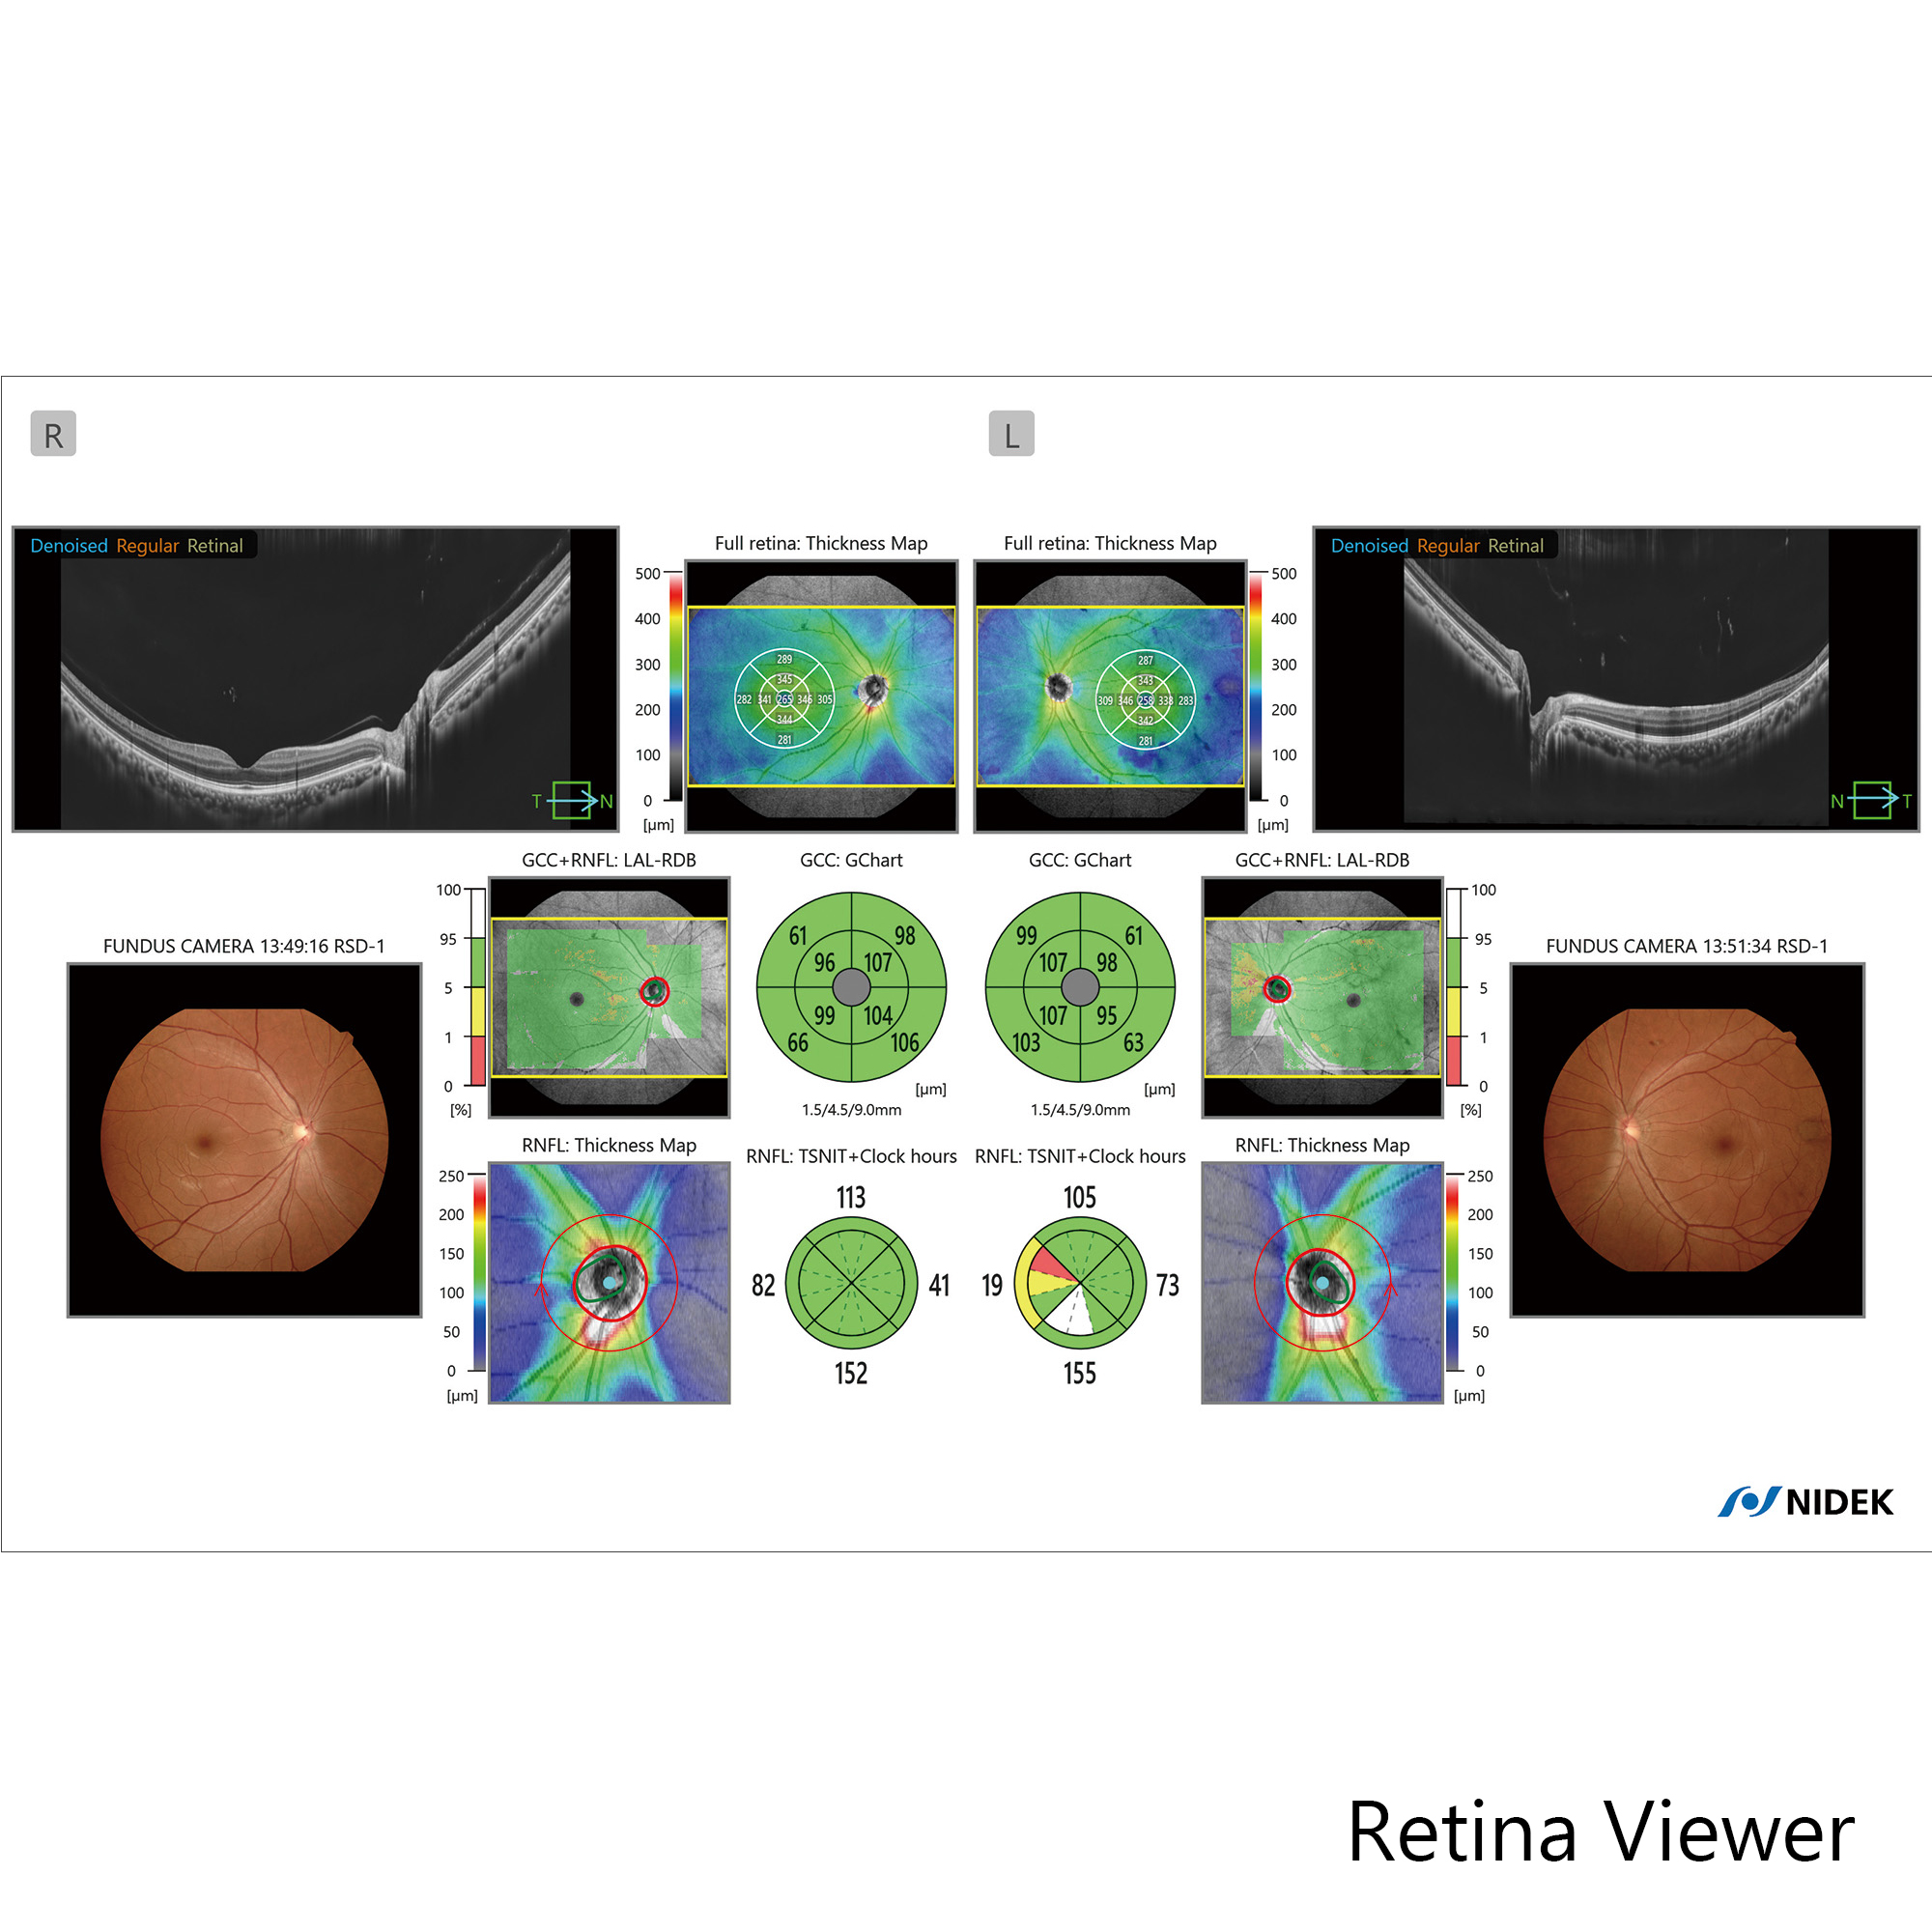
- Retina Viewer* performing advanced analysis on the OCT/OCT-A images
– Deep learning segmentation (DL segmentation)
– Structural Normality Map (SN Map) facilitating rapid interpretation
– B-scan/OCT-A denoise**
– OCT-A quantitative analysis functions for rapid assessment
– Follow-up analysis with automatic image registration
– Analysis of anterior segment
*Optional for EyeLink
**Optional for Retina Viewer
-
Detailed Information
Platform to store, manage, analyze and display eye care data
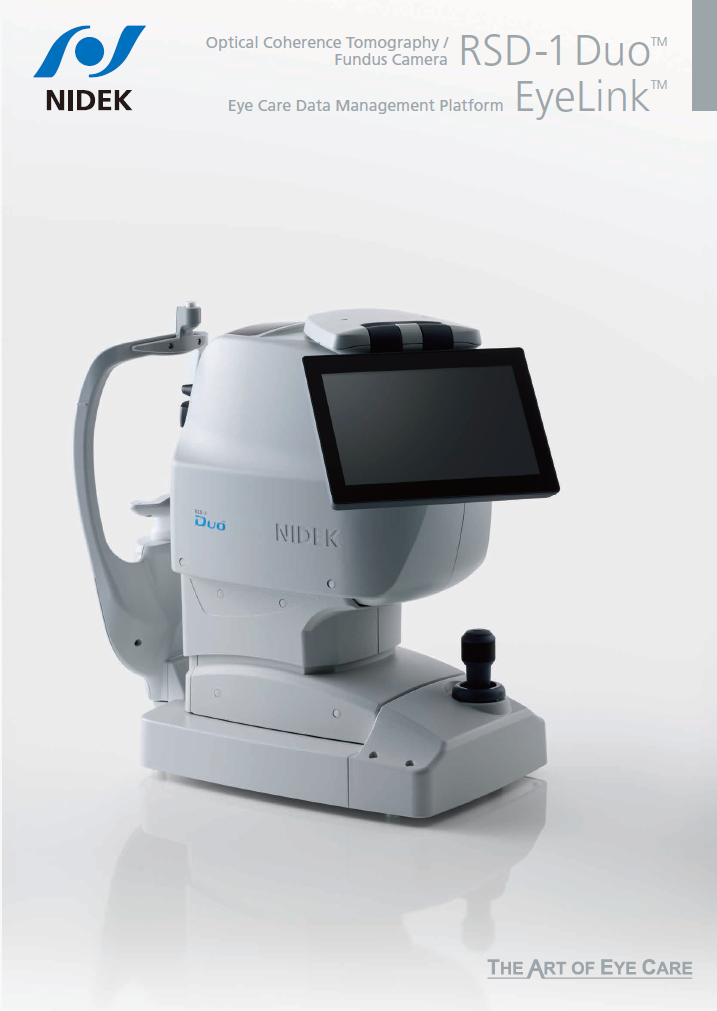
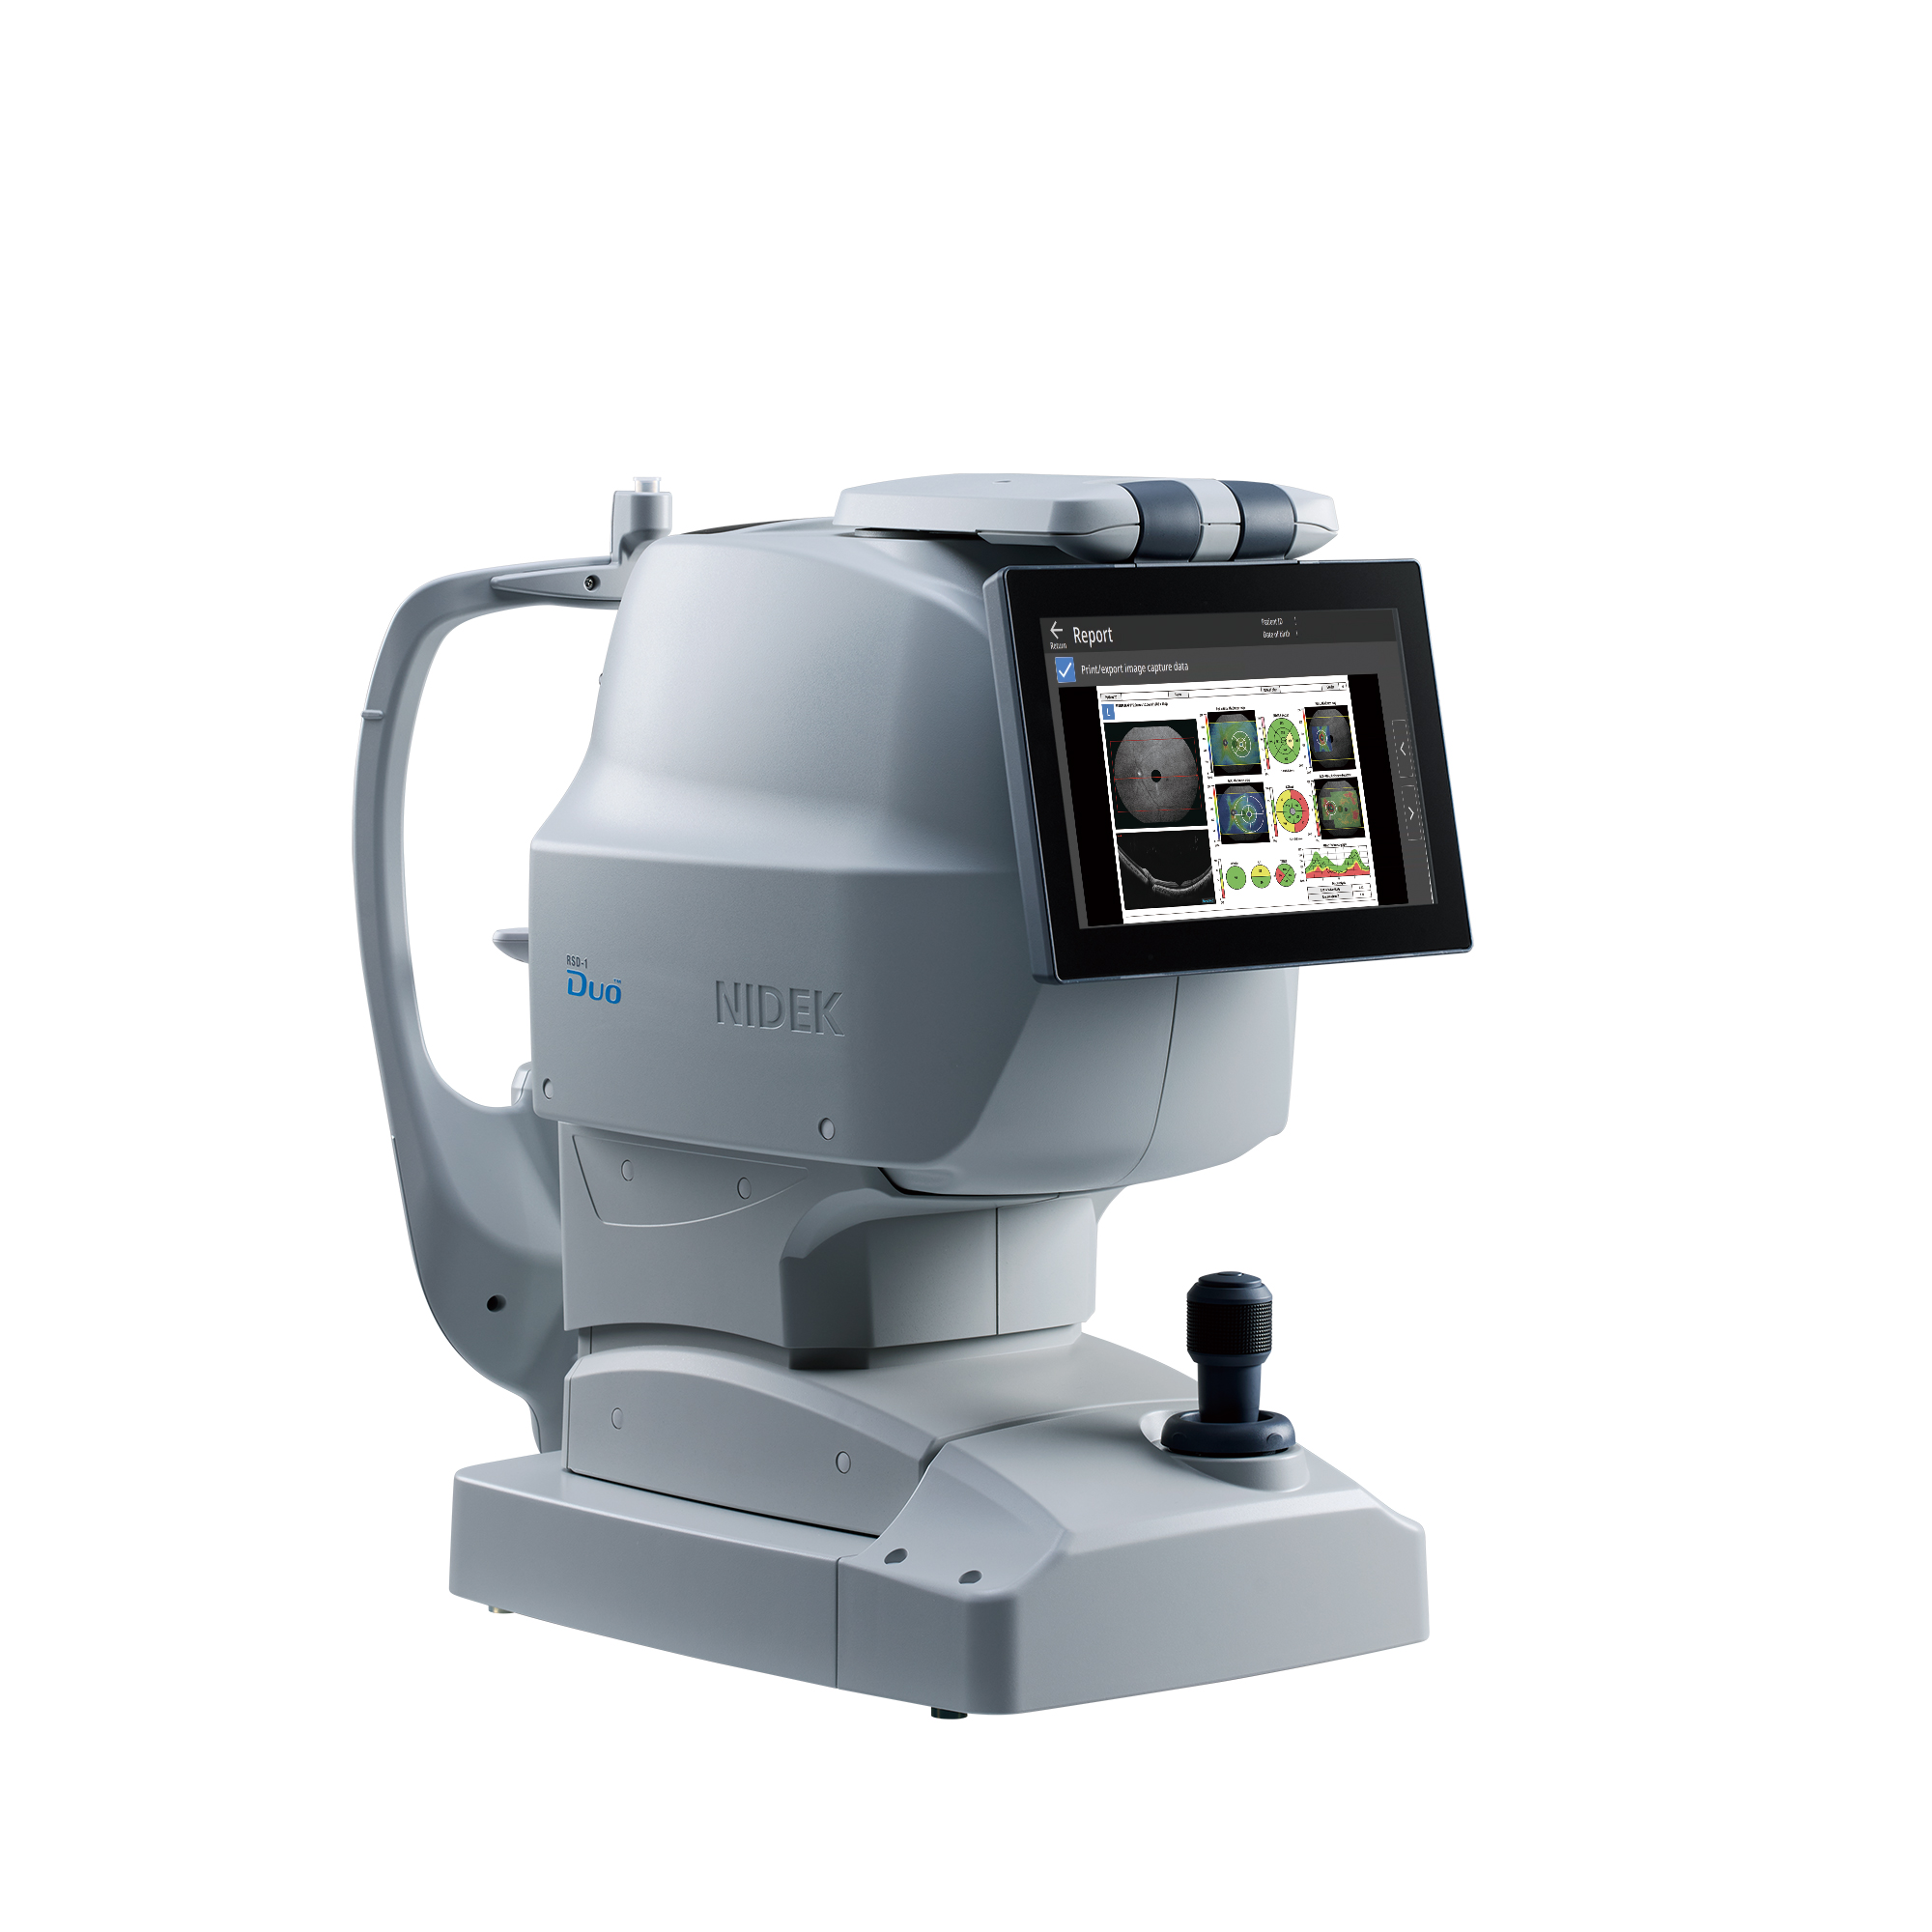
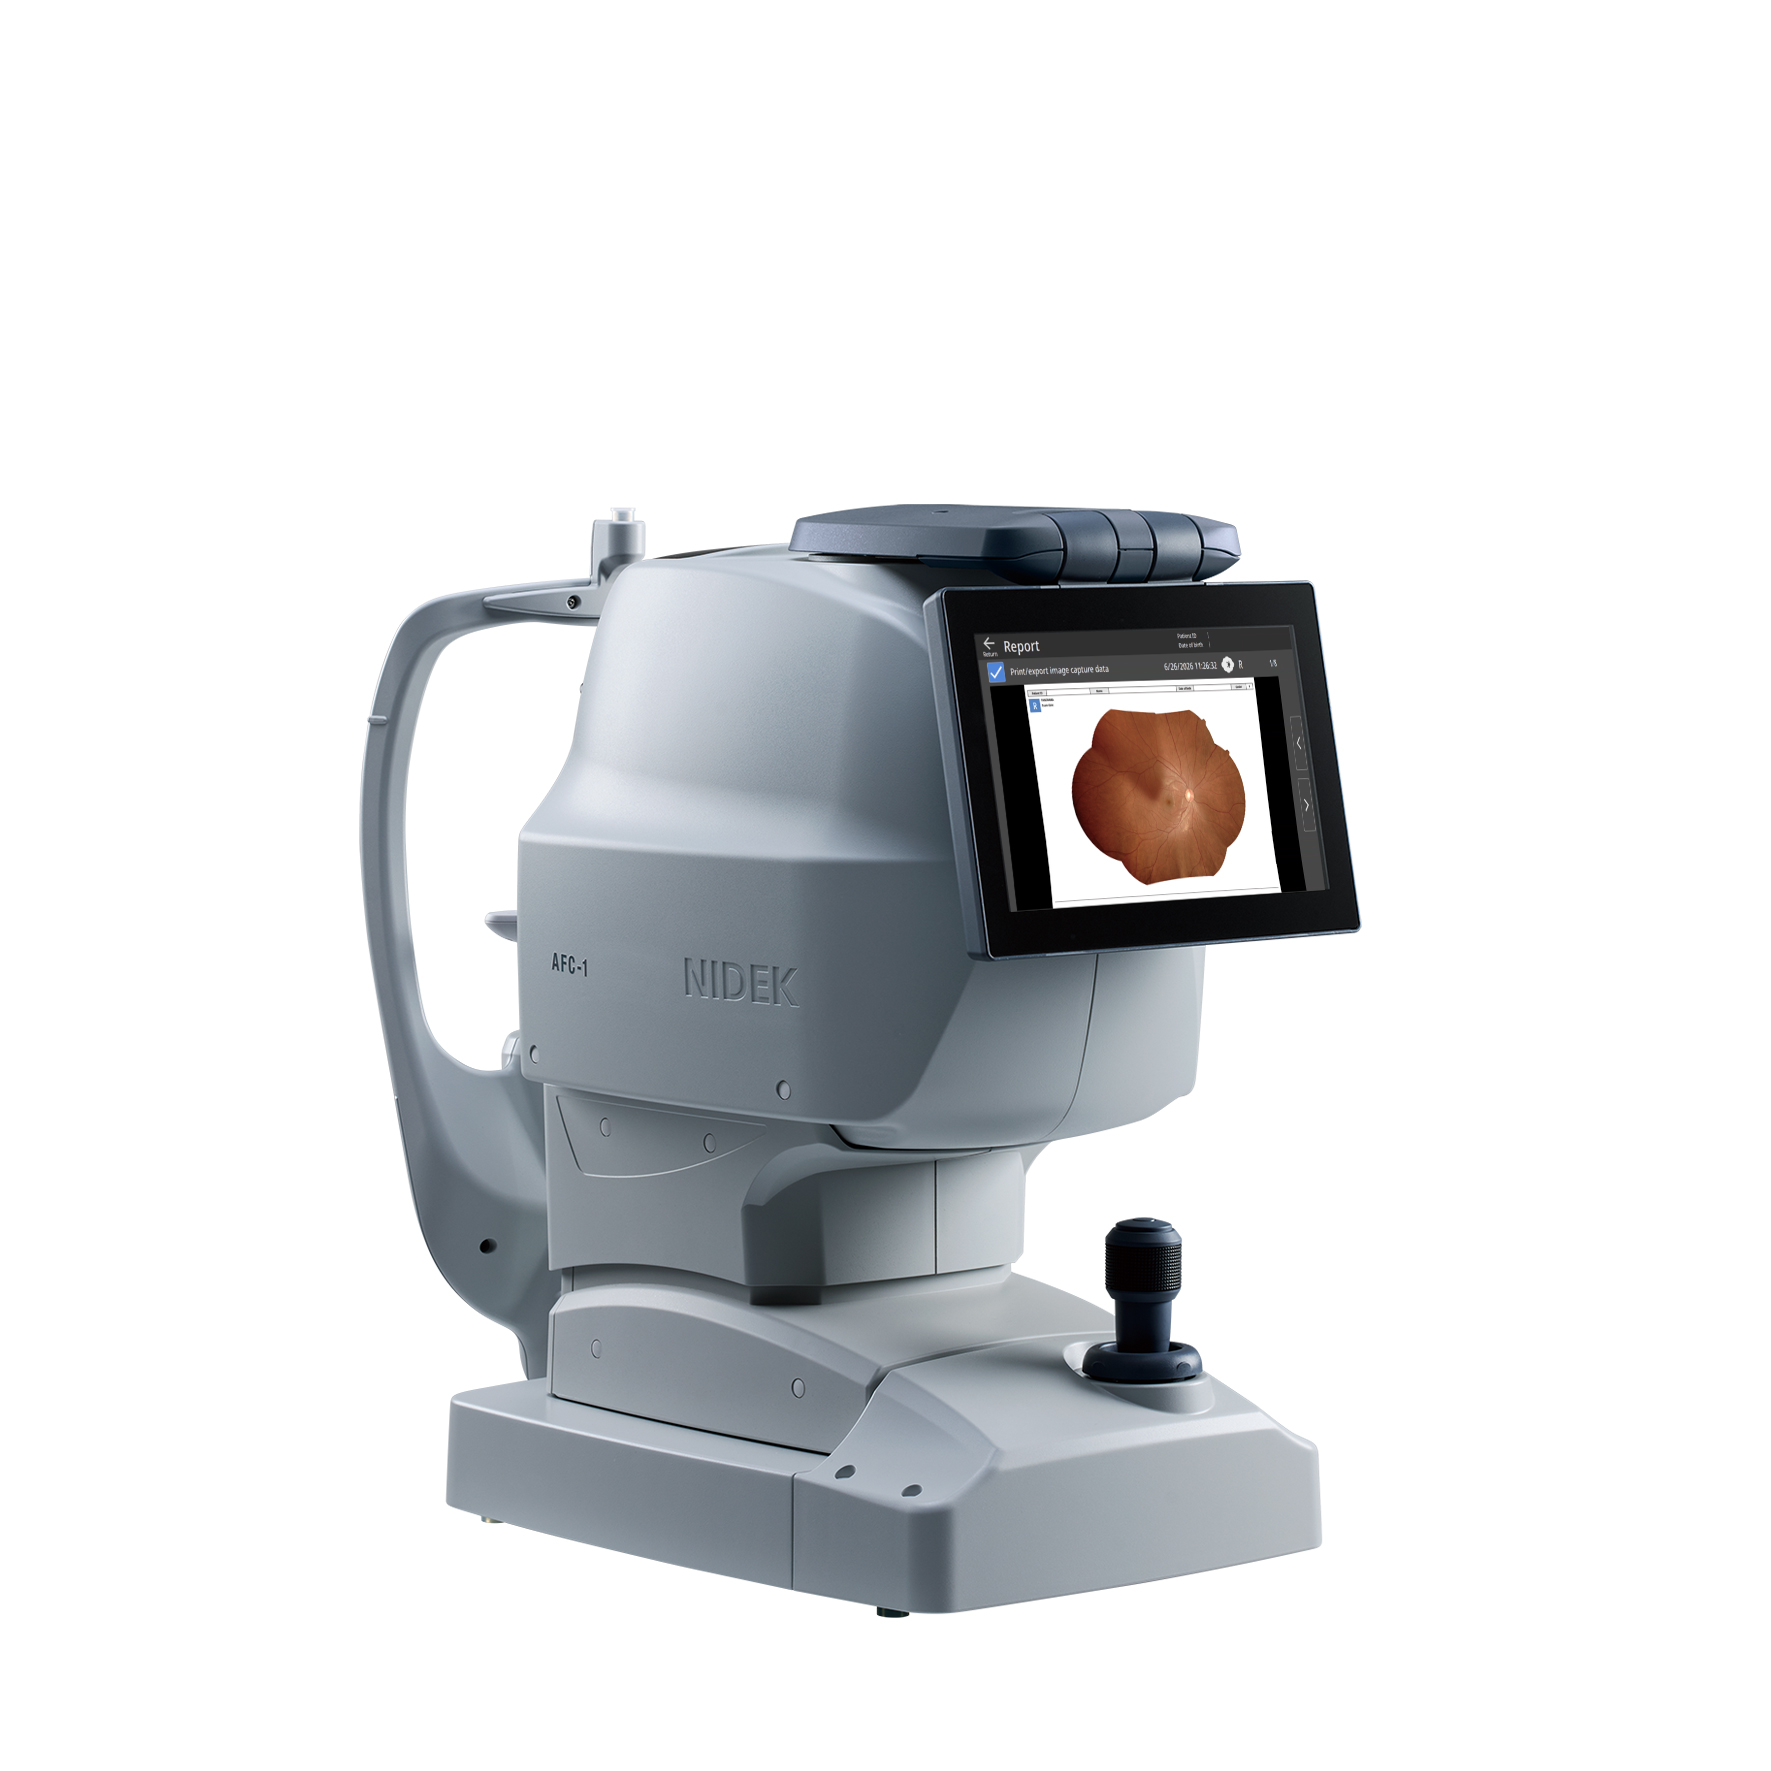
| The images captured with the RSD-1 Duo and AFC-1 can be automatically sent to EyeLink, when connected, which stores all patient data on its server, enabling multiple PCs throughout the clinic to access the data and review images.
Additionally, Retina Viewer, an optional dedicated viewer application, performs advanced analysis on the OCT and OCT-A images. |
 |
Retina Viewer performing advanced analysis on the OCT/OCT-A images
Deep learning segmentation (DL segmentation)
| Less affected by a lesion or image contrast, the DL segmentation detects the edge of each layer on a B-scan image. Based on this highly precise segmentation, the SN Map can show subtle changes. | 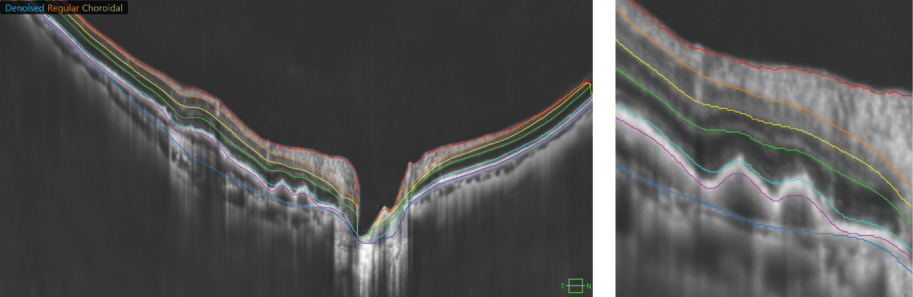 |
Structural Normality Map (SN Map) facilitating rapid interpretation
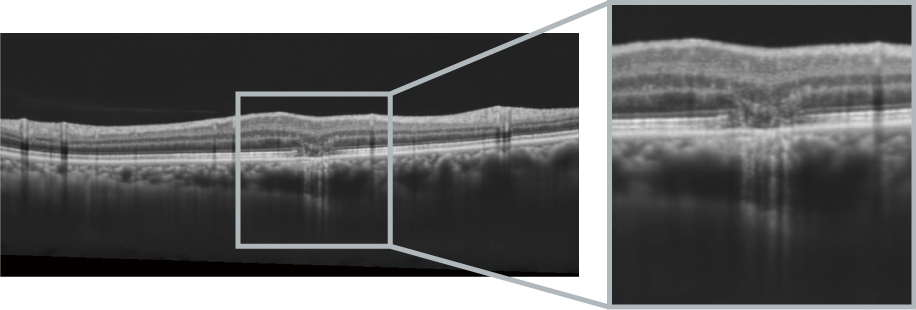
| The SN Map detects and highlights structural abnormalities including subtle retinal changes. This function clearly indicates a region of interest, layer by layer, and enhances clinical efficiency by reducing interpretation time. | 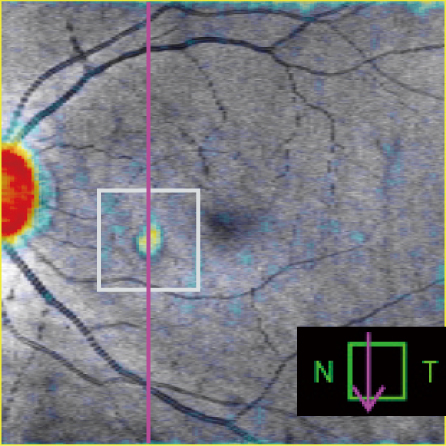 |
 |
B-scan/OCT-A denoise
| The B-scan denoise license (optional) applies denoise on all scan images. It reduces the time for image acquisition for staff and patients while providing high quality images for clinicians.
The optional OCT-A denoise license generates images equivalent to averaging five separate acquisitions. Detailed visualization of microvasculature supports confident interpretation and reduces the risk of missed findings. |
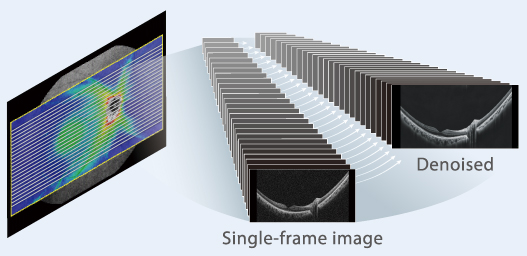 B-scan denoise on all scan images B-scan denoise on all scan images |
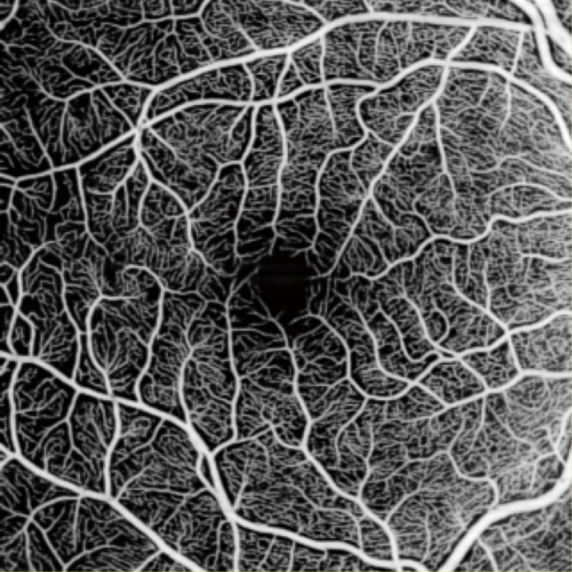 Image after OCT-A denoise Image after OCT-A denoise |
OCT-A quantitative analysis functions for rapid assessment
| Vessel area density (VAD) map Quantification of vessels in each layer provides metrics to assess disease progression and the effects of treatment.
Autodetection of FAZ and shape analysis
Comparison for follow-up assessment |
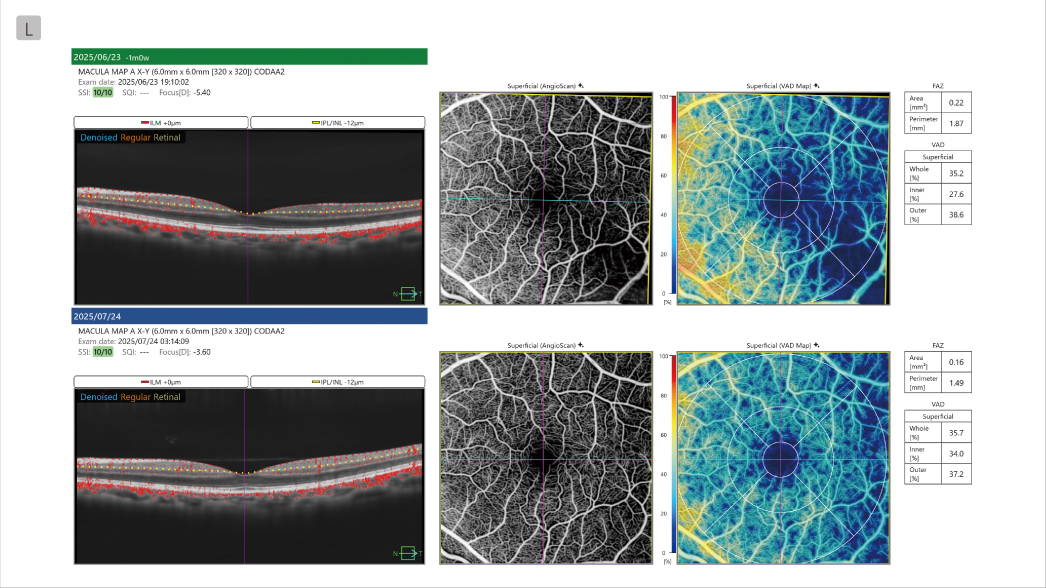 OCT-A comparison display with VAD map and FAZ analysis OCT-A comparison display with VAD map and FAZ analysis |
Follow-up analysis with automatic image registration
| Even for maps with different scan sizes and/or orientations, chronological changes can be displayed automatically at the same location. Data from the previous model and RSD-1 Duo can also be combined and presented at the same location for follow-up analysis. | 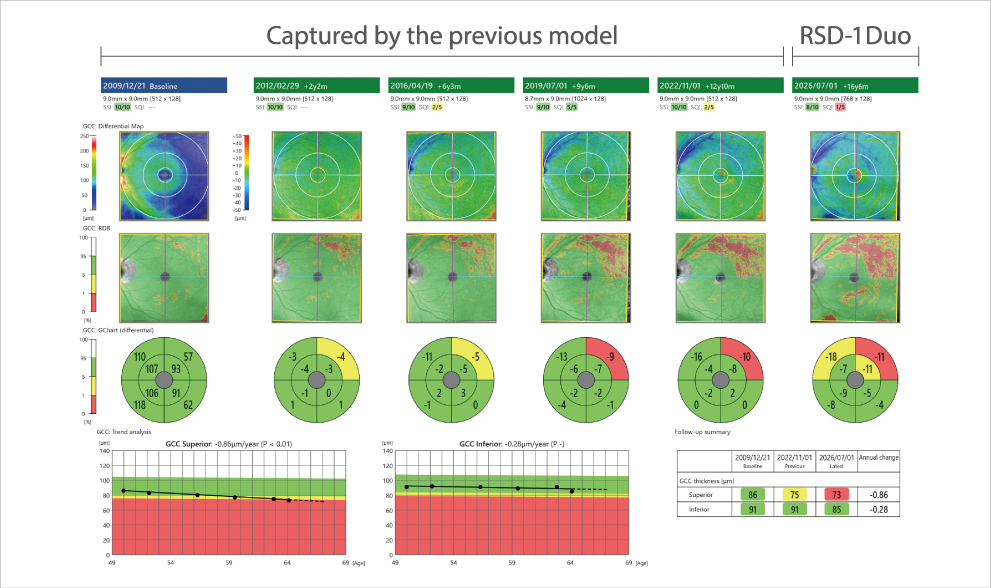 |
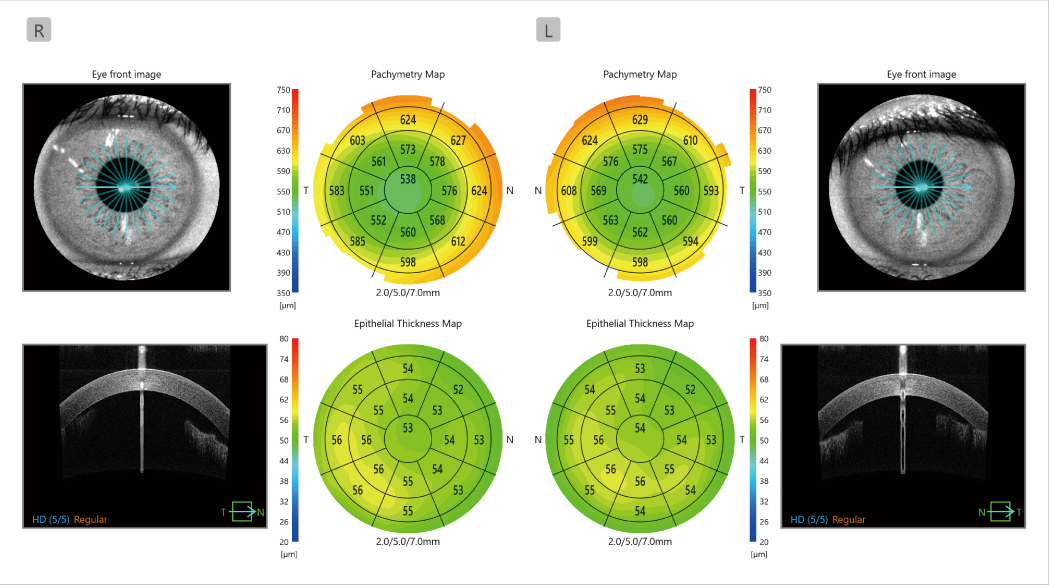
Analysis of anterior segment
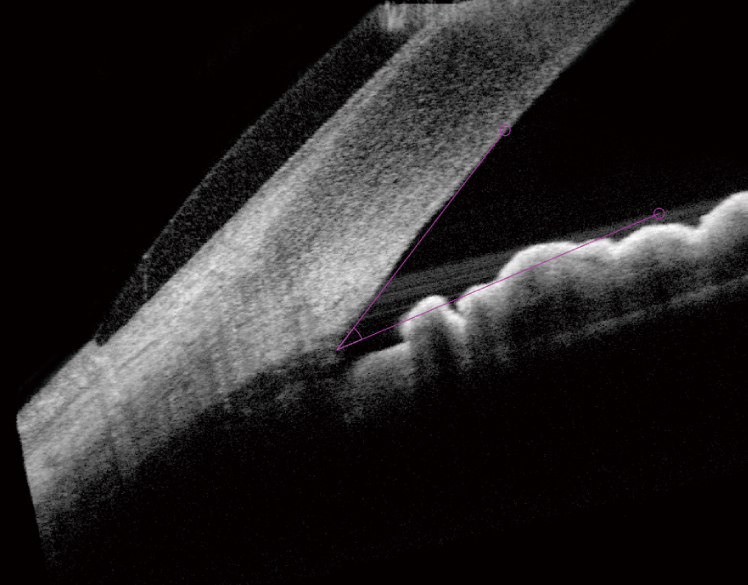
| Anterior chamber angle (ACA) analysis This feature helps clinicians detect eyes at risk of angle closure and assess changes in ACA caused by glaucoma progression or treatment effects.
Pachy map and epithelium map |
 |
 |
Downloads

Videos
Product Information
|
Related Products
NOTE
The availability of products differs from country to country depending on the status of approval.
Specifications and design are subject to change without notice.
- Product/model name
- Eye Care Data Management Platform EyeLink