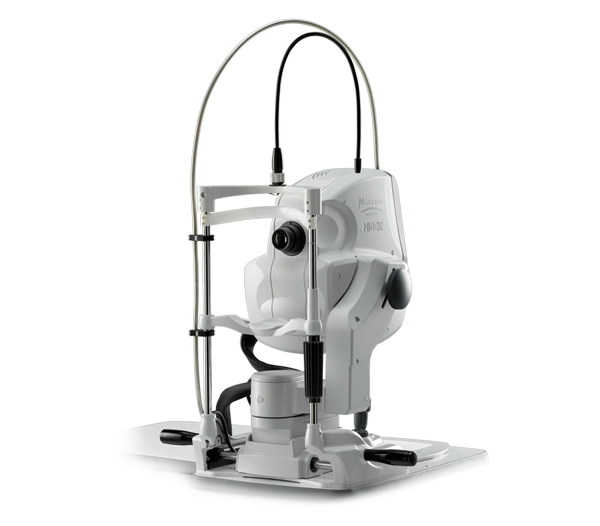
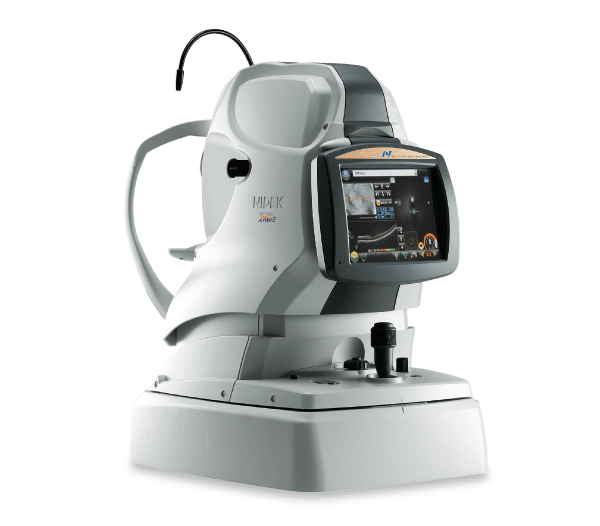
OCT-Angiography option for the Mirante SLO/OCT and Retina Scan Duo™ 2
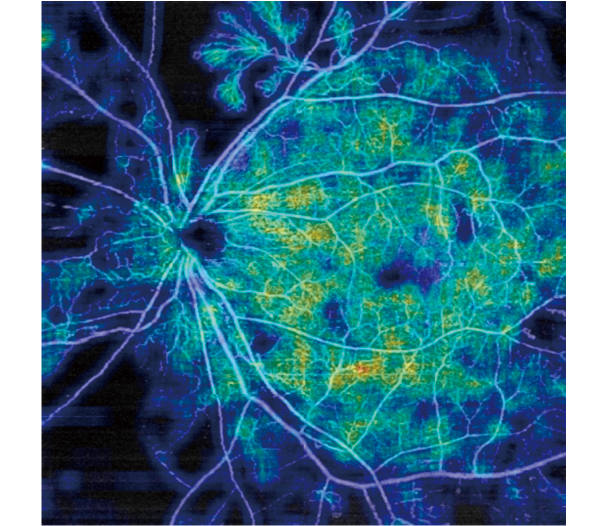
Features
- Comprehensive OCT-Angiography imaging and diagnostics
- The tracing HD plus function for accurate image capture
- Selectable definition and fine mode
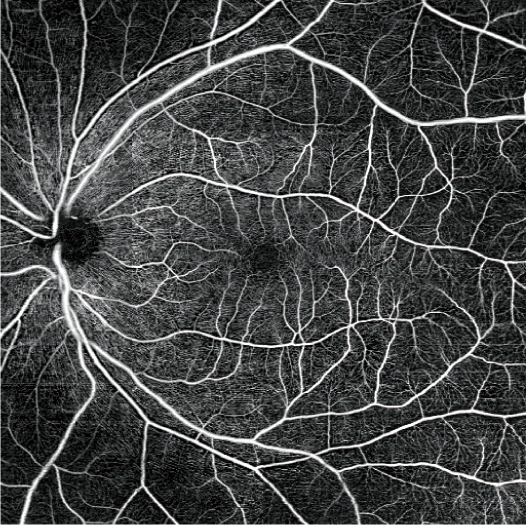
- Wide area scan
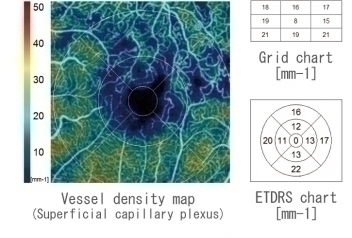
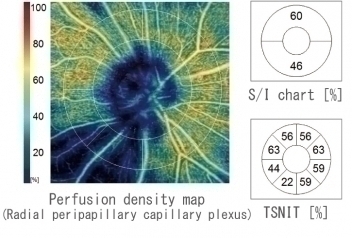
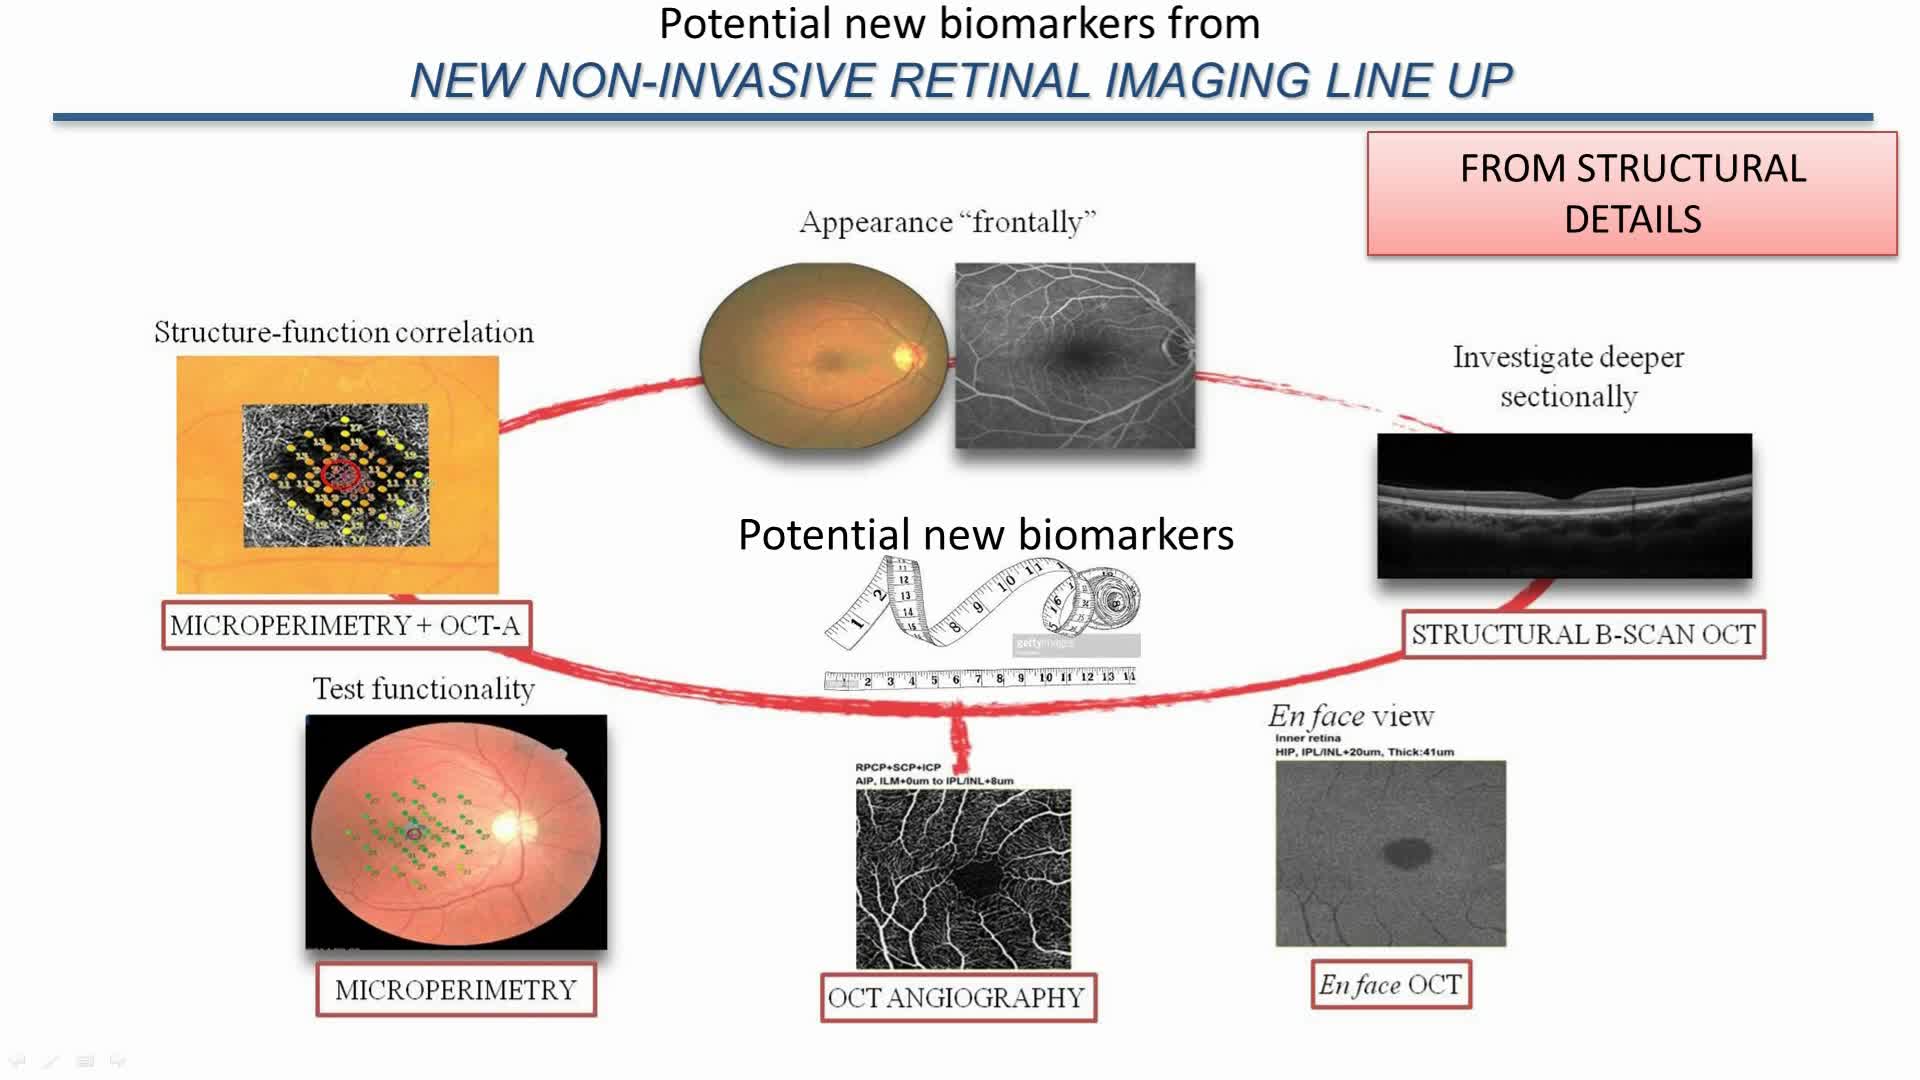
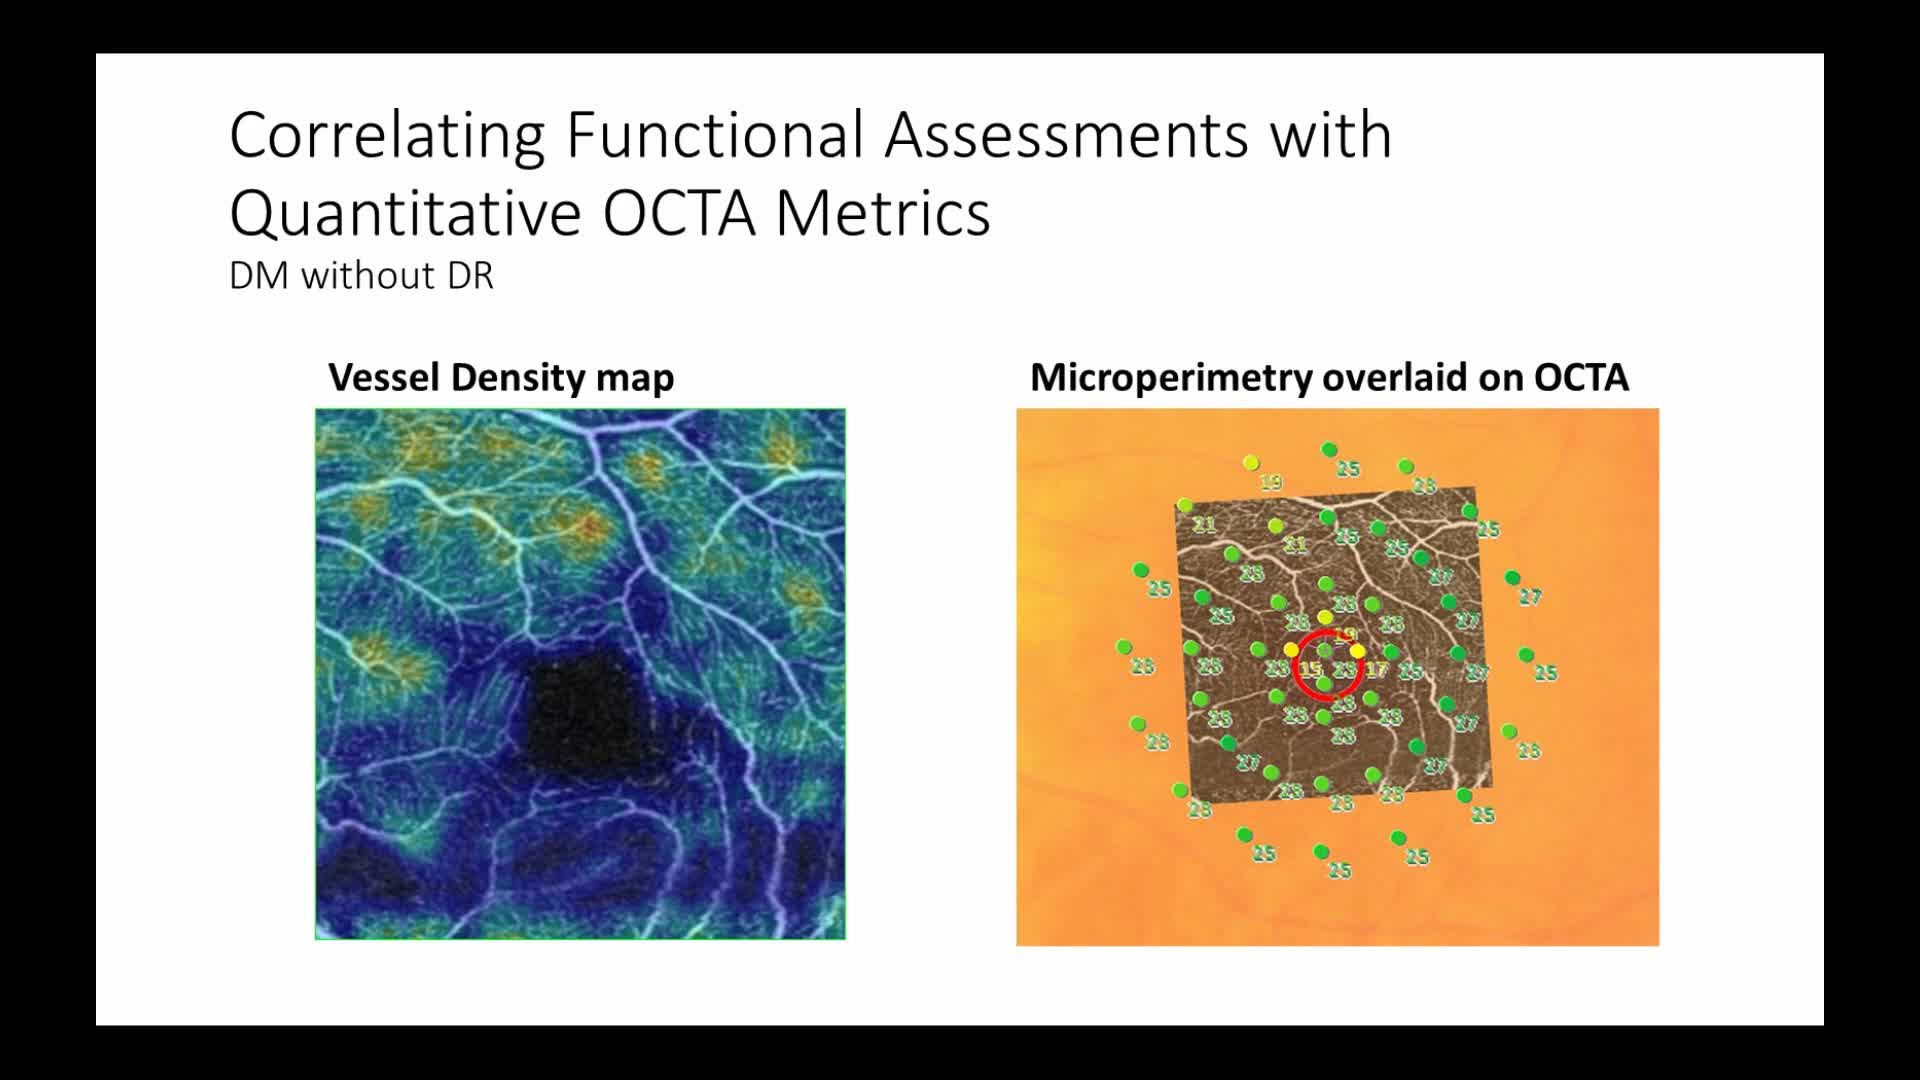
- Vessel density map and perfusion density map
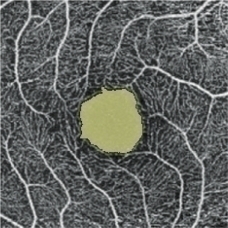
- Autodetection of FAZ and shape analysis
Detailed Information
Comprehensive OCT-Angiography imaging and diagnostics
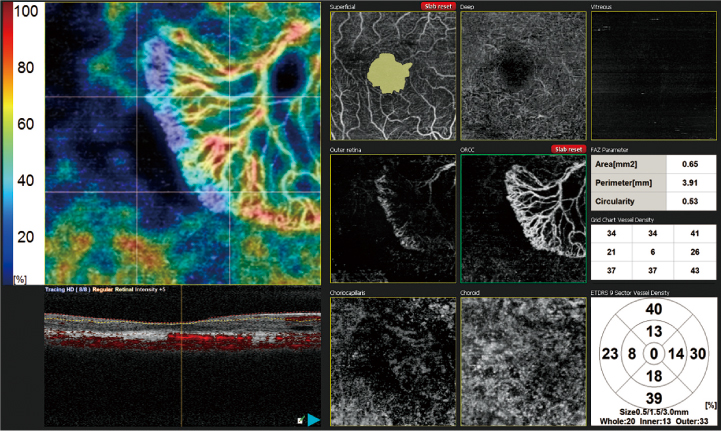
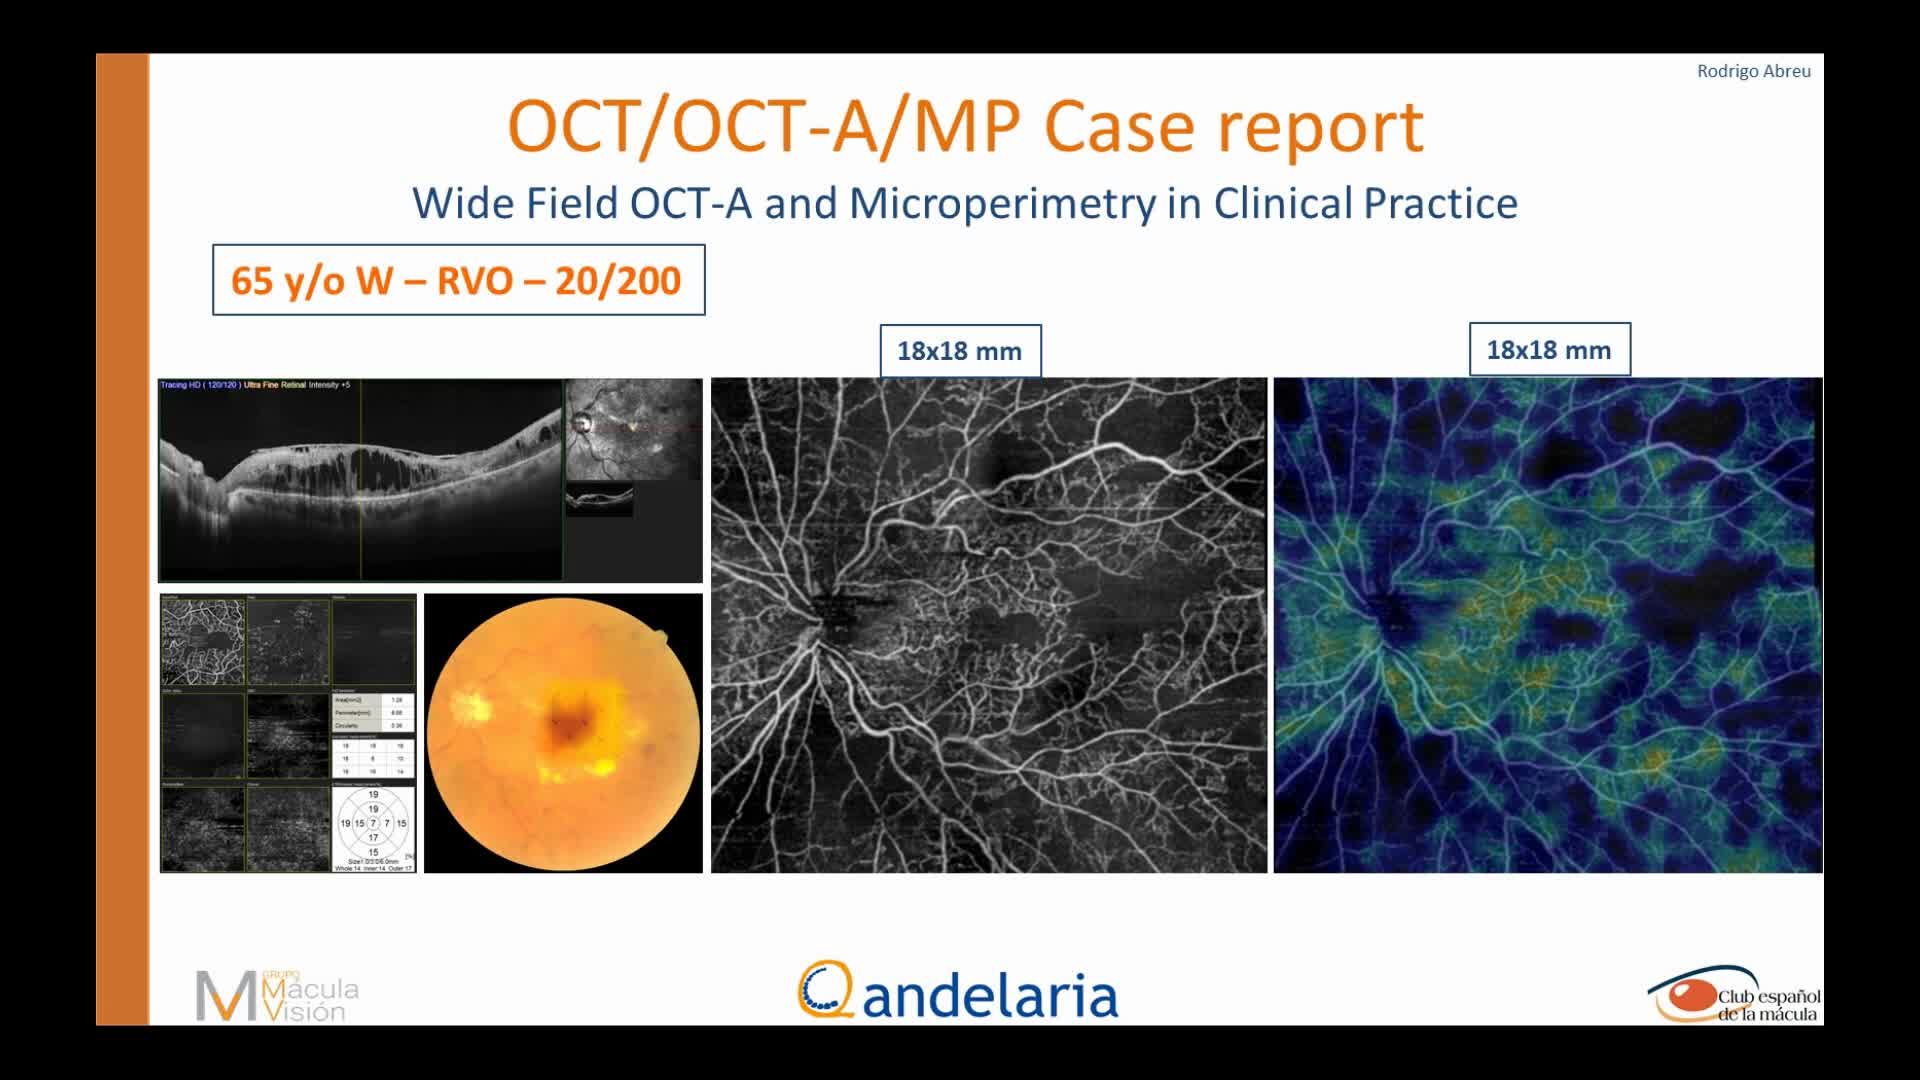
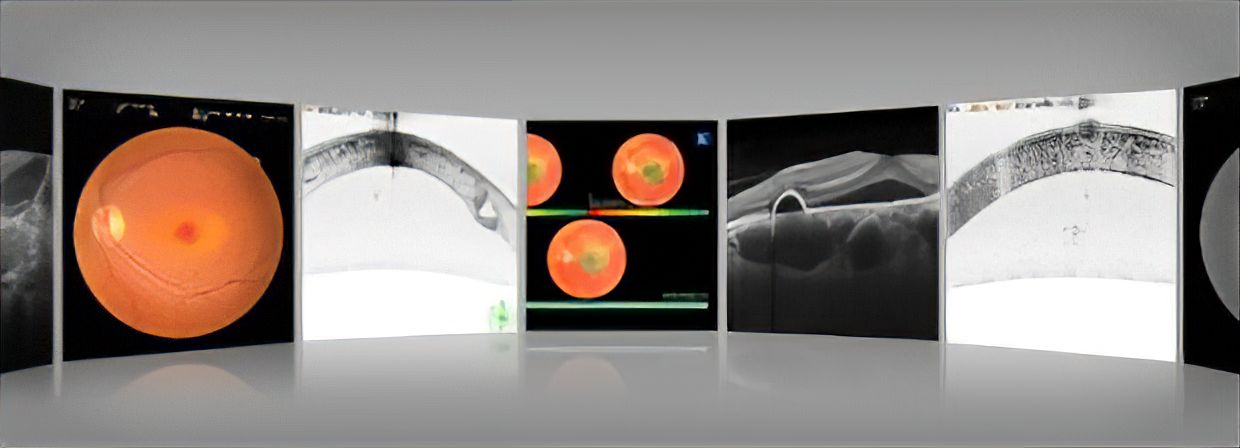
The simple interface provides seven slabs for the macula map / four slabs for the disc map with intuitive functionality and removal of projection artifacts. Segmentation into multiple slabs allows enhanced assessment of retinal microvasculature at specific depths and regions of interest.
Macula AngioScan: Macula Map
-Vitreous, Superficial, Deep, Outer retina, ORCC, Choriocapillaris, Choroid
Optic Nerve Head AngioScan: Disc Map
-Vitreous, Nerve head, Radial peripapillary capillary plexus (RPCP), Lamina cribrosa
Image courtesy of Dr. Alejandro Villalobos
The tracing HD plus function for accurate image capture
- The tracing HD plus function tracks eye movement to maintain the same scan location on the SLO image for accurate image capture.
- Based on the clinical requirement, the tracing function can be set for high definition and high contrast imaging. Images can also be captured within seconds without the tracing function.
*Available for the Mirante SLO/OCT
Selectable definition and fine mode
- Two, four, or eight scans per line (2 HD, 4 HD, or 8 HD) can be selected. 8 HD provides high quality images combined with the tracing HD function.
- Fine mode OCT angiography results in high-resolution images to enhance diagnosis.
*Available for the Mirante SLO/OCT
Wide area scan
Vessel density map and perfusion density map
Autodetection of FAZ and shape analysis
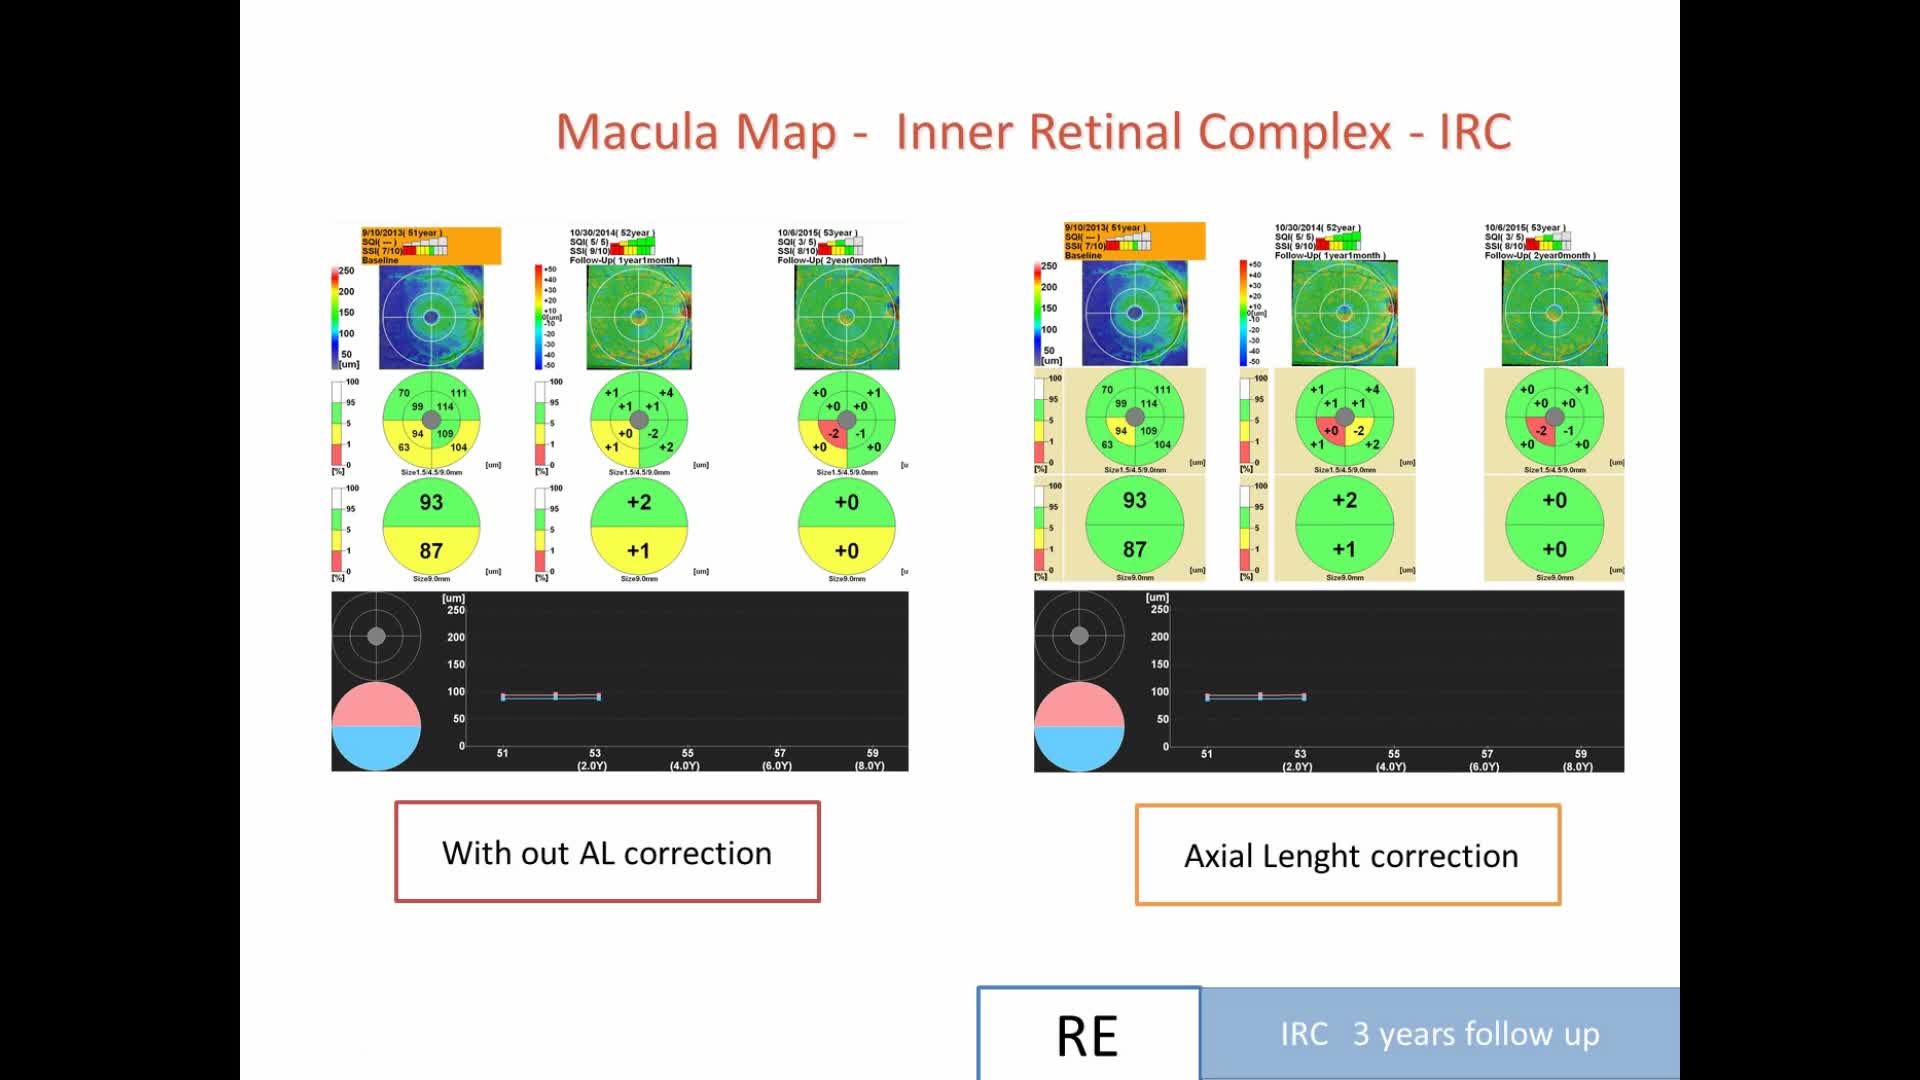
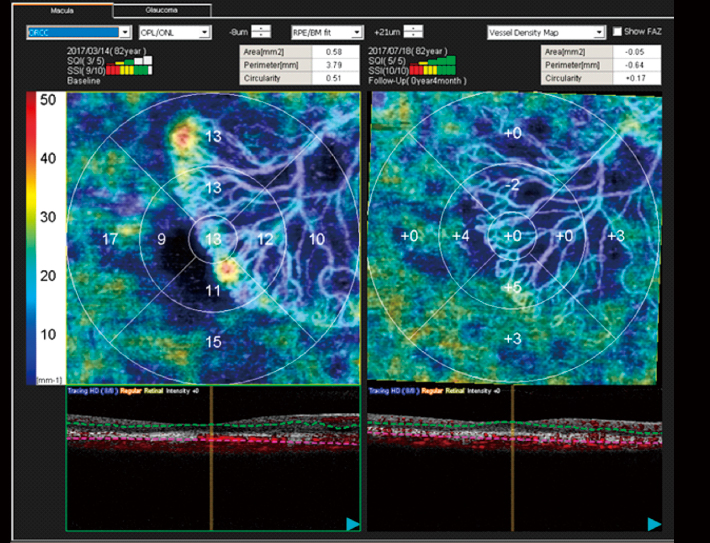
Follow-up function
The follow-up function presents the changes over time, in vessel density or perfusion density in easily understandable maps. Data are presented in chronologic order to evaluate vascular changes with disease progression.
*Available for the Mirante SLO/OCT and Retina Scan Duo™ 2
 |
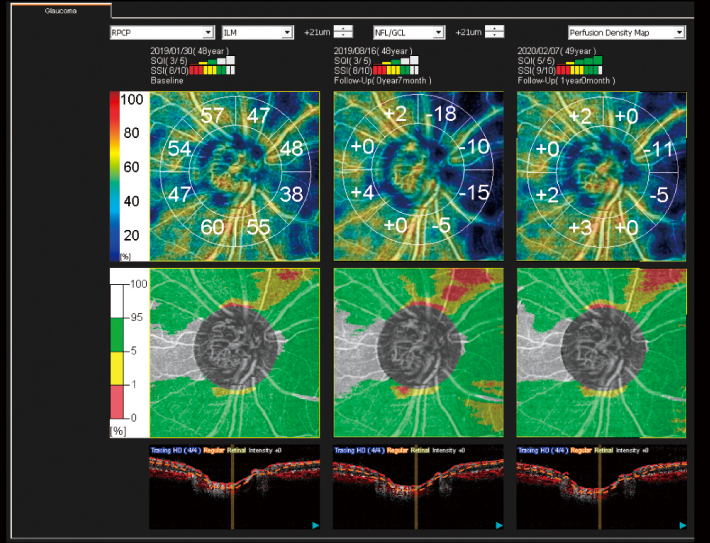 |
Image courtesy of Dr. Alejandro Villalobos
Downloads
Videos
Related Products
NOTE
The availability of products differs from country to country depending on the status of approval.
Specifications and design are subject to change without notice.










 TOP
TOP
